Evaluation of
demographic status and related factors in mortality of patients suspected of
COVID-19 admitted to Razi Hospital in Rasht
Morteza Rahbar Taramsari 1*, Ali Monfared 2, Alireza Badsar
1, Hamid Mohammadi Kojidi 1,
Shima Ildari 3, Jalal Kheirkhah
4, Saeed Najjar Soltani 3*,
Fatemeh Saberhamishegi 3, Erfan Bozorgzade Ahmadi 3,
Habib Eslami Kenarsari 5
1 Department of Forensic Medicine, School of Medicine, Guilan
University of Medical Sciences, Rasht, Iran
2 Urology Research Center, Razi Hospital, School of Medicine, Guilan University of Medical Sciences, Rasht, Iran
3
Inflammatory Lung Diseases Research Center, Guilan
University of Medical Sciences. Rasht, Iran
4
Department of Cardiology, Healthy Heart Research Center, School of Medicine, Guilan University of Medical Sciences, Rasht, Iran
5
Clinical Research Development Unit of Poursina Hospital, Guilan University of Medical Sciences, Rasht, Iran
* Corresponding Authors: Morteza
Rahbar Taramsari * Email: rahbar_m46@yahoo.com
Saeed Najjar Soltani
* Email: saeed_najjarsoltani@yahoo.com
Abstract
Introduction: SARS-CoV2 is the third strain from Corona family with zoonotic roots
which has spread among humans from the beginning of this century. We conducted
this study to examine mortality and its related factors among all patients
admitted to Razi Hospital with suspicion of COVID-19 between February and April
2020.
Materials
and Methods: In this analytical cross-sectional study, after obtaining permission
from the ethics committee under the university’s research deputy, the required
information such as demographic data, clinical symptoms and imaging study
results was collected by reviewing records of all patients with COVID-19
suspicion.
Results: From 1792 cases, 1045 patients were male and 747 patients were female.
Mortality was 27% in all patients and 30% and 22% in men and women. The highest
hospitalization rate was in the age group of 51-60 years and the highest
mortality rate was in the age group of 81-90 years. 1472 patients lived in
urban areas and 316 patients in rural areas. 997 patients had 93% O2 Saturation
and less, of which 36% died. PCR test was performed for 505 patients, of which
69% were positive. Chest CT scan was performed in 96% of patients and chest
X-ray was performed in 66% of patients with COVID-19. The most common symptoms
were shortness of breath, cough, fever, chills, weakness, nausea and headache,
respectively. The highest mortality was in patients with impaired consciousness
at the beginning of hospitalization.
Conclusion: The results of the present study showed that male gender, older age,
history of underlying disease, Chest x-ray involvement, drug use, shortness of
breath and lesser O2 Saturation are associated with adverse outcomes,
constitutional and gastrointestinal symptoms are associated with better
outcomes in patients with COVID-19.
Keywords: Coronavirus, Acute respiratory syndrome, SARS-CoV-2, COVID-19,
Mortality
Introduction
Coronaviruses
are a type of Coronaviridae. Coronaviridae
is a family of enveloped, sensitive, positive, single-stranded RNA viruses that
has the largest viral genome (26-33 kb) among RNA-infected viruses. The family Coronaviridae consists of two subfamilies called "Coronavirinae" (Coronavirus) and "Torovirinae" (Torovirus).
Coronavirus can be divided into four groups based on phylogenetic
classification: "Alpha, Beta, Gamma and Delta" (1). Few studies are showing that bats
can host many types of coronaviruses, which varies depending on the habitat and
the type of bat (2).
In
general, coronaviruses cause a mild respiratory illness in humans with
cold-like symptoms; But the ability to cause severe and even fatal respiratory
diseases has been proven (3). A type of coronavirus called
"Coronavirus 2019" was identified on December 31, 2019, in Wuhan,
China, also known as "COVID-19". According to the analyzes, the amino
acid positions of 501, 723 and 1010 have changed with the SARS virus, a stable
mutation in non-structural protein 2 (nsp2) has resulted in COVID-19 being more
contagious than in SARS. Also, the nsp3 destabilizing mutation caused an
acceptable difference between SARS and COVID-19 (4). In a 2020 study by Huang C et al.
to evaluate clinical findings in patients with coronary artery disease,
laboratory features included leukopenia (25%), lymphopenia (25%), and increased
aspartate aminotransferase (Seven of the 28 patients are non-ICU(
37%)). In ICU patients, prothrombin and D-dimer levels were increased in
admission compared to non-ICU patients. Elevated troponin (troponin-sensitive I
(HS-cTnI)) was detected in five patients, possibly
indicating virus-associated myocardial damage. Abnormalities in computed
tomography (CT) of the chest were observed in all patients. Ninety-eight
percent had a two-way conflict, and grand glass turbidity was generally seen.
Complications included acute respiratory syndrome (29%) and secondary infection
(10%) (5). In a 2020 study, Salehi et al.
performed imaging findings in patients with coronary artery disease. One of the
known features of COVID-19 in primary CT is multilobar
ground-glass (GGO) opacity with peripheral or posterior distribution, mainly in
the lower lobes and less in the right middle lobe. Abnormal early imaging
findings of GGO opacities may be seen in a smaller number of cases, mainly in
the elderly. Septal thickening, bronchiectasis, pleural thickening, and
subpleural involvement are some of the less common findings, which are mainly
seen in later stages of the disease. Pleural effusions, pericardial effusions,
lymphadenopathy, cavitation, halo symptoms, and pneumothorax are very rare but
may be seen as the disease progresses (6). Follow-up of CT in the next stage of
the disease, with an increase in the number and size of GGOs and gradual
conversion of GGO to multifocal turbidity, thickening of the septum and the
formation of a paving pattern, is seen most strongly in CT findings on day 10
after the onset of symptoms. The acute respiratory syndrome is the most common
symptom for the transfer of patients with COVID-19 to the ICU and the leading
cause of death in this patient population. Imaging patterns of clinical
improvement usually occur after 2 weeks of illness and include the gradual
removal of opacities and a reduction in the number of lesions and lobes involved
(6). Since various factors from age,
gender and place of residence, to underlying diseases and special medical
conditions from common cases such as diabetes to special cases such as cancer
treatment or organ transplantation, along with the patient's symptoms are known
to be effective in disease severity and outcome. In this study, the mortality rate
of patients suspected of having COVID-19 was admitted in February and April
2020 and their relationship was examined based on statistical analysis.
Materials and Methods
Study
population
In
this cross-sectional-analytical study, after obtaining permission from the
Ethics Committee in University Research at Guilan
University of Medical Sciences (IR.GUMS.REC.1399.245), the data of all
hospitalized patients suspected of having COVID-19 based on positive signs in
favor of Corona, CT scan report and simple chest X-ray report in Razi Hospital
in Rasht during February and April 2020 were reviewed.
Statistical
analyses
After
collecting the data, the data were entered into SPSS software version 22 and to
describe them, relevant and appropriate statistical tables and graphs were
extracted. Chi-square and Fisher tests were used to investigate the possible
relationship between the variables and the outcome of patients' deaths.
Results
In
order to conduct the study, 1796 files were studied and 4 files were excluded
due to lack of information. According to Table 1, out of 1792 patients, 484
(27%) died and 1308 (72.9%) recovered. There were 1045 male and 747 female
patients, which accounted for 58.3% and 41.6% of the population of COVID-19
patients admitted during February and April 2020, respectively. 315 patients
(30.1%) died among men and 169 patients (22.6%) among women. This rate is 17.5%
for dead men compared to the total number of patients studied and for women
9.4%. There was a statistically significant relationship between being a man
and mortality rate (P <0.001); Male patients were more likely to die than
female patients.
Table 1. Frequency distribution of gender of
patients in terms of outcome.
|
Gender
|
Consequences
|
Total
|
P-value
|
|
Recovery
|
Death
|
|
Male
|
Number
|
730
|
315
|
1045
|
<0.001
|
|
Percent
|
69.8%
|
30.1%
|
100.0%
|
|
Percent of total
|
40.7%
|
17.5%
|
58.3%
|
|
Female
|
Number
|
578
|
169
|
747
|
|
Percent
|
77.3%
|
22.6%
|
100.0%
|
|
Percent of total
|
32.2%
|
9.4%
|
41.6%
|
|
Total
|
Number
|
1308
|
484
|
1792
|
|
Percent
|
72.9%
|
27.0%
|
100.0%
|
|
|
|
|
|
|
|
82.3%
(1472 people) of patients admitted to the city and 17.7% (316 people) lived in
the village. The mortality of patients living in urban areas was 25.5% (375
cases) and 33.5% (106 cases) among villagers. Rural residents were higher than
urban residents (33.5% vs. 25.5%).
The
age of the patients in the study was between 16 and 100 years with a mean of
58.8 ± 15.7. The mortality rate of patients over 58.5 years was 37.8% and in the group less than 58.5 years was 15.5%. There was a
statistically significant relationship between age over 58.5 years and death
rate (P <0.001); This means that patients aged 59 years and older died more
than those aged 59 years (37.8% vs. 15.5%).
8
patients (0.4%) in the age group of 16-20 years (100% recovery), 61 patients
(3%) in the age group of 21-30 years (90% recovery, 9% death), 183 People (10%)
in the age group of 31-40 years (90% recovery, 9% death), 308 people (17%) in
the age group 41-50 years (82% recovery, 7% death), 396 people (22% ) In the
age group 51-60 years (78% recovery, 21% death), 385 people (21%) in the age
group 61-70 years (67% recovery, 32% death), 273 people (15%) in the age group
-71 80 years (59% recovery, 40% death), 158 people (8%) in the age group 81-90
years (53% recovery, 46% death), 20 people (1%) in the age group 91-100 years
(55% recovery) , 45% feet). The highest hospitalization rates for both men and
women were in the age group of 51 to 60 years with 12% and 9%, respectively.
The highest mortality rate of men, as well as all patients regardless of
gender, was in the age group of 81 to 90 years (46%) and for women in the age
group of 91 to 100 years (55%).
The
mean length of hospital stay of the studied patients was 5.4 days with a
standard deviation of 4.7 days. Considering the cut-off of 5.5 days; 1147
patients have been hospitalized less than this period, with a death rate of
28.7% (329 cases) (68.8% of all deaths) in this group and 23.4% (149 cases)
(31.2% of total deaths) among patients who have been hospitalized for more than
this period. Deaths). There was a statistically significant relationship
between the length of hospital stay and death rate (P = 0.016) so that in
patients with a length of hospital stay of 5 days and less than patients
admitted more than 5 days more death rate occurred (28.7% vs. 23.4 %).
Based
on the information in Figure 1; 9.1% of patients were smokers, 3.9% were opium
users, and 0.9% of patients admitted reported smoking and opium at the same
time. In these three groups, the mortality rate was 25.5%, 45.6% and 46.7%,
respectively. The mortality of people who had no history of smoking or opium
(1484 people) was 25.9%. There was a statistically significant relationship
between opium use (with or without smoking) and mortality (P = 0.002); Patients
with a history of opium addiction (with or without smoking) had a higher
mortality rate than those without a history of addiction.

Figure 1. Frequency of patients by the
history of smoking and opium.
Based
on the information; 64.6% of hospitalized patients reported a positive history
of underlying diseases. The mortality rate in this group was 32.7%, while among
patients with no history of the underlying disease (35.4% of patients), 16.5%
died and 83% recovered and were discharged. The number of people who had no
underlying disease or previous medical history and died made up 5.9% of the
total study population and the remaining 21.1% of the population who died had a
history of the underlying disease. There was a statistically significant
relationship between having a history of one of the underlying diseases and
mortality (P <0.001); So that in any of the underlying diseases, the
mortality rate was higher than people without a history of any disease.
Of
all the cases, 151 were hospitalized in the intensive care unit, of which 131
(86%) died and 20 recovered. Of these, 115 (76.2%) had a history of the
underlying disease. 93 people (61%) were men. There was a statistically
significant relationship (P <0.001) between hospitalization in the intensive
care unit and death outcome. There was also a statistically significant
relationship (P <0.001) between male gender and history of the underlying
disease with hospitalization in intensive care unit; So that male patients
either with a history of underlying disease were admitted to the intensive care
unit more than female patients or without a history of the underlying disease,
and also among patients admitted to the intensive care unit more death rate
than Occurred patients admitted to the emergency department.
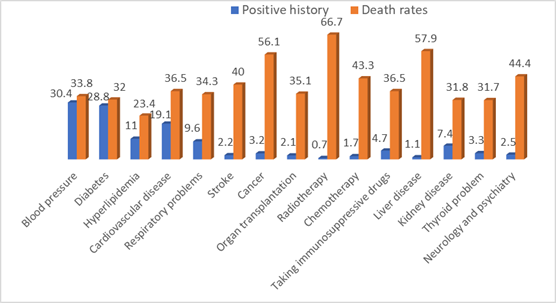
According
to Table 2 and Figure 2; Mortality in patients with hypertension was 33.8%. It
is noteworthy that 38.3% of all deaths were due to this disease and 73% of
recovered people had no history of this disease. Also, the death rate among
people who did not have a history of hypertension was 23.9%. Diabetes improved
by 68%, compared with 75% among people without a history of diabetes (excluding
other diseases). 23.4% of patients with hyperlipidemia died.
The
mortality rate among hospitalized cardiovascular patients was 36.5% and 7% of
the total population died with a history of this disease. A history of stroke
has been associated with 40% of deaths. Also, the mortality rate in respiratory
diseases was 34.3% and 12.2% of the total death population were involved in
respiratory diseases.
In
conditions of suppression or immune system disorders such as cancer,
chemotherapy and radiotherapy, as well as the use of immunosuppressive drugs
and a history of transplant mortality was higher than the total average. The
highest mortality rate was among people with a history of radiotherapy (66.7%).
There
was a statistically significant relationship (P <0.001) between the history
of hypertension, cardiovascular disease, history of cancer and mortality. Also between diabetes (P = 0.003), liver disease (P = 0.004),
history of radiotherapy (P = 0.005), history of respiratory disease (P =
0.024), neurological disease (P = 0.010) and use of suppressive drugs Immune
system (P = 0.046) was also observed to have a statistically significant
relationship with mortality. So that the death rate in patients with any of the
above diseases was higher than patients with a negative history of that
disease.
There
was no statistically significant relationship between hyperlipidemia, CVA,
kidney and thyroid disease and history of organ transplantation and mortality.
Discussion
In a cross-sectional analytical study, after obtaining permission
from the ethics committee in the research department of Guilan
University of Medical Sciences, a list of all cases admitted to Corona with
suspicion during February and April 2020 in Razi Educational and Medical Center
in Rasht was prepared. The list included 1,796 patients. The outcome of 4
patients in the files was not known and 1792 cases entered the statistical
analysis process. The mortality rate was 484, representing 27% of the study population.
In a study by Tehrani S et al. In Karolinska, Sweden, on 255 patients, 27%
died. Most deaths occurred during hospitalization and within the first 30 days.
The reason for the high mortality rate of this study was the lack of use of
corticosteroids or other specific treatments that were later proven to be
effective. In this study conducted in Karolinska, 90% of deaths were observed
among patients 65 years and older (44% mortality rate) (7). In a British study of 20133
hospitalized patients with COVIDium 19, this rate was
26% (8).
The overall mortality rate based on inpatients and outpatients in
the study of Nikpouraghdam et al., Was estimated to
be 1.85%. This rate was 8.06% in hospitalized patients (9). In a study by Zhonghua
et al., The mortality rate of critically ill patients hospitalized in China was
reported to be over 49% (10). In a study of 22,512 patients in
Italy, the overall mortality rate in COVID-19-confirmed patients was 7.2%. This
value was 2.3% in China (11).
Of these deaths in our study, 263 were positive PCRs and were
considered definitive COVID. If we consider the mortality of 2.3% for this disease,
this number of PCR feet (positive and total death) in proportion to the
representative of 11 to 21 thousand are affected, and a high percentage of this
number of people are asymptomatic or have mild and actual symptoms. There were
reservoirs of disease in the community, a conclusion that can be disputed with
the results of a study by Hu et al. In the Hu study, the results showed that
among those in close contact with a definite case of COVID who were examined
and their PCR results were positive, 20.8% had a short interval, 50% had
positive CT findings, while 20.8% of these cases were never symptomatic; These
populations were significantly younger (12). Considering that all medical centers
in Rasht at that time had dedicated special wards to patients suspected of
having COVID-19, we suggest that a similar study be performed in all centers
and by combining the results of these studies and conducting a review study. A
clearer picture of the disease situation at that time can be obtained. In this
study, 58.3% of hospitalizations and 65.1% of deaths were male OR (1.85:1). A
total of 30.1% of hospitalized men and 22.6% of hospitalized women died.
Similar findings were found in many studies (13, 14). Also, during the results of Nikpouraghdam M study with Logistic Regression analysis,
age, male gender and underlying diseases have a significant effect on mortality
in COVID-19 patients (5018 In MERS and SARS, men were more affected than women (15). Women are less likely to be
infected due to the X chromosome and sex hormones that affect innate acquired
immunity (16). According to Sunil S. Bhopal et
al. study, although the number of male patients was not different from the
number of female patients, COVID-19 mortality was twice as high in men as in
women, which could be due to genetic and lifestyle differences (such as
occupation, cigarettes and alcohol) and cultural and social differences. Of
course, it is worth noting that the mortality rate of men to women in different
age groups is different, for example, during this study, the mortality rate of
men to women in the age group of 0-9 years was 0.8, while in the age group of
60-69 years 2 .6 was obtained (17). In the study of Caizheng Yu et al., The median age was 64.0 years (18). With increasing age and more
production of type B cytokines, T-cell and B-cell function is impaired and
causes a worse prognosis in elderly patients. In general, higher mortality in
men can be due to social and economic factors and a more prominent presence of
men in bioeconomic and social (19, 20).
The higher mortality of the rural population is consistent with the
results of the Khan study. In Khan's study, this issue, which does not seem to
be consistent with population density and the spread of more disease in cities,
was attributed to the cumulative effects, differences and discrimination
between urban and rural area (21).
Higher mortality in opium use indicates the association between
opium use and the severity of the disease when hospitalized. These results are
similar to the results of a meta-analysis performed in China (22). We suggest comparing the course
and clinical status of COVID-19 in these patients and comparing it with
patients who are not addicted to opium and smoking. The results of such a study
can be used to inform the whole community and create a negative factor about
addiction.
21.1% of the total population have been hospitalized and died with a
history of underlying disease. The most common diseases included hypertension
and diabetes. 38.3% of all deaths were due to this disease, if this statistic
is combined with the fact that 75% of people with improved blood pressure do
not have the disease, the impact of this disease on more severe cases and
weaker consequences associated with this disease can be Analyzed. In our study,
there was a statistically significant relationship between hypertension and
death outcome (P <0.001). In various studies such as meta-analysis by Yang
et al. And meta-analysis by Zheng et al., The underlying diseases of diabetes,
hypertension, cardiovascular disease and hyperlipidemia have been associated
with a worse prognosis (23, 24). In our study, the highest death
rate was among cancer patients undergoing radiotherapy, with 66.7% of the
population dying. After that were patients with liver disease (57.9% feet, P
<0.05) Next ranks of cancer (56.1%) Chemotherapy (43.3%) Neurological
diseases (44.4%) History of CVA ( 40%), cardiovascular
diseases (36.5%) and the use of immunosuppressive drugs (36.5%), respiratory
diseases (34.3%), organ transplants (35.1%) and diabetes (32%). All of these
are significantly associated with a weaker immune response to the presence of
an infectious agent in the body. Also in the study of Chirag Shah et al.,
Kidney and heart disease were significantly associated with COVID's mortality (13)
Many other studies have shown an association between the incidence
of Acute Kidney Injury and coronary mortality (25). Although the mechanism of kidney
damage has not been elucidated in COVID-19, many studies have suggested an
association between renal involvement and SARS-CoV-2 (26, 27).
In the Tehrani S. study, chronic kidney disease and previous (old)
stroke are independent risk factors for coronary mortality. The association
between previous stroke and mortality of COVID-19 may be due to disabilities or
a high risk of coagulation disorders. The two most common underlying diseases
in this study were hypertension (54%) and diabetes (31%) (7). This finding was confirmed by
other studies (28, 29).
In some studies, hypertension was identified as an independent risk
factor for severe COVID-19. It should be noted, however, that hypertension is a
common disease worldwide with an incidence of 78% in people aged 65 to 74 in
Sweden. After statistically adjusting for age, they found that there was no
relationship between blood pressure and mortality (30) .
Other studies confirm the findings that people with underlying
diseases such as cardiovascular disease, hypertension, diabetes, congestive
heart failure, cerebrovascular disease, chronic kidney and liver disease,
cancer, COPD, asthma and HIV / AIDS have a higher risk of death from COVID-19 (31). As the number of articles and
studies published increases, so does the difference between the results
obtained. Some have confirmed the link between COVID-19 mortality and the
underlying disease, and some have denied it. On the other hand, it is clear
that in regions with higher mortality rates (such as the United States, Europe
and China), the prevalence of underlying diseases was generally higher than in
other regions (32). The SARS-CoV-2 virus is activated
by ACE2, which binds to cells. ACE2 is expressed on heart, kidney and type 2
alveolar cell (33). There is a hypothesis that prior
use of ARBs can increase ACE2 at the cellular level, leading to more morbidity
and mortality in people with ARBs underlying diseases (34). The results of a meta-analysis by Ssentongo P. et al. Show that people with COVID-19 with
cardiovascular disease, hypertension, diabetes, congestive heart failure,
chronic kidney disease, and cancer are at higher risk for COVID-induced death.
There are 19. According to this meta-analysis, patients with COVID-19 who have
cardiovascular disease are twice as likely to die (35).
Another possible hypothesis for a high risk of mortality in
patients with the underlying disease could be due to body depletion or
allostatic load. In other words, chronic diseases disrupt the physiological
function of the body and result in the accumulation of pro-inflammatory cytokines.
These cytokines affect the cellular immune system. Due to the weakened immune
system, these patients are at risk for severe forms of COVID-19 disease and
death (36).
In the Yang JK study, plasma glucose levels and diabetes were
independent predictors of mortality in SARS. In diabetic patients, affinity for
cell binding and virus entry into the cell and the risk of cytokine syndrome
are higher, virus clearance and T-cell function are lower (37).
Many of these diseases are strongly associated with the patient's
lifestyle and are the result of the accumulation of the effects of various
factors such as genetics, nutrition, mobility, smoking and drugs, the final
effect of which usually occurs after prolonged exposure to risk factors.
Considering the profound effect of this pandemic on human morale and following
the news and cases related to this disease, a study can compare the effects of
this disease between this group and healthy people without a history of
underlying disease and by including items such as regular exercise. Mobility
rate, consumption of fruits and vegetables among the study variables provided
significant information to the community. Such studies will have a strong
impact on the approach and mindset of the country's population in the present
time. Indeed, an accident (pandemic) is not reported, but getting ready to
increase the chance of survival is a human preoccupation.
Among the symptoms studied in this study, a group of symptoms that
referred to pulmonary involvement, including shortness of breath and low O2Sat,
along with a history of altered level of consciousness, were associated with
worse outcomes, while constitutional symptoms and gastrointestinal symptoms
were associated with improvement. These results are consistent with the results
of a study by Zheng et al. In his study, often respiratory symptoms at the time
of admission were associated with a worse prognosis (22). In our study, the worst symptom
was a decrease in the patient's level of consciousness, which occurred in 70.2%
of cases of hospitalization of patients with this symptom.
The main manifestation of COVID-19 during this pandemic was
respiratory symptoms associated with hypoxia, followed by respiratory failure
and mechanical support and extracorporeal failure (38). Of the two predictors, at least
O2Saturation is stronger. Maximum body temperature during hospitalization is
also an important predictor. However, not all patients with fever present (26). In a study by Z. Wu et al., Out of
44500 definitive cases of COVID-19, 80% presented with mild respiratory
symptoms and 19% with severe respiratory symptoms and severe illness including
respiratory failure. Some patients also progressed to severe complications,
including multiple organ failure, septic shock, pulmonary edema, severe
pneumonia, acute respiratory syndrome, and death (39).
Identifying predictors can help physicians prioritize patients and
assign treatment options as well as vaccines.
During the Shah C. study, respiratory symptoms were the most common
manifestation among deceased patients (72.11% shortness of breath, 51.70%
cough). Also, the percentage of patients who initially presented with positive
imaging findings was higher among the death group (82.31%). The incidence of
active cancer was higher in the group of deaths, but this variable could not
predict the mortality of COVID-19 due to the small number of samples (13).
In the Mehraeen E. 10 study, the most
common manifestations in 310494 COVID-19 patients were fever, cough, olfactory
dysfunction, postnasal drip, taste disturbance, and nasal obstruction (14).
In Iran, a study was performed on 2964 patients with COVID-19
admitted to the hospital between February to April 2020 (approximately
corresponding to the time of this study) and showed that 14% of COVID-19
patients had a serious disease and 6 Severely ill and a total of 20% needed hospitalization.
Among 239 feet, 66.94% were 60 years of age or older and 15.89% had underlying
disease (such as diabetes, hypertension, and chronic lung disease, etc.) (9).
In a study, by separating
the two populations, the difference in outcome and the relationship between
different symptoms and the severity of the disease can be investigated. The
results of such a study will be useful in setting a more up-to-date guideline
in dealing with patients suspected of having COVID-19.
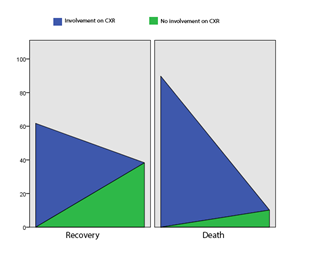
The use of paraclinical methods in the diagnosis and prognosis of
the disease is helpful in many clinical conditions. In this study, lung
involvement in plain chest radiography was most strongly associated with
mortality. Comparison of CT scan and PCR results showed no statistically
significant relationship between their positivity and death. Whereas in plain
chest X-ray data, only 4.7% of cases whose CXR lacked evidence of pulmonary
involvement died.
A study by Tabatabaei S. et al. Showed that CT Scan severity, based
on parenchymal involvement, could be a good predictor of mortality in healthy
adolescents with COVID-19 pneumonia. Young patients are often healthy and
present with shortness of breath and a mild fever, but their disease may worsen
over time. This study emphasizes that in CT Scan reports, the number of lobes
involved and the severity of the involvement along with its morphological
pattern must be mentioned in order to measure the severity of the disease (40). Although routine use of CT scans
to detect COVID-19 is not recommended, many studies have suggested its role in
the follow-up of patients (40). Due to
the higher cost of CT scans, it is recommended that after a thorough examination
of the lungs to check for the presence and extent of pulmonary involvement, CXR
is recommended. In the case of PCR, the high mortality rate among PCR-negative
individuals and the lack of statistical differences between PCR-positive and
PCR-negative deaths, it seems that the PCR result should have been more
positive (41). It is recommended that a study be
performed on the knowledge of the treatment staff about how to properly take
and maintain the sample to evaluate SARS-CoV2. It is also possible to design
and conduct a study to review the results presented by different laboratories
to analyze the amount of error in both sampling and sample review. Also, due to
the cluster spread of this disease among families and the existence of a very
significant number of asymptomatic carriers of COVID-19, it is possible to
randomly select several COVID-19 patients and perform PCR test among their
asymptomatic family members. With a short two-week follow-up, it is possible to
identify a proportion of asymptomatic people and inform the community of the
danger that threatens them by publishing the results.
In our study, 86.7% of ICU patients died, which is consistent with
Shah C.'s study. The ratio of the number of patients admitted to the ICU in the
death group was higher than the recovery group (23.13% vs. 6.18%). Patients in
the death group were older than the recovery group (mean 78.4 vs. 64.1) (13).
Conclusions
The results of the present study
showed that male gender, older age, history of the underlying disease, simple
chest X-ray involvement, drug use and pulmonary symptoms were associated with
more adverse outcomes and natural and gastrointestinal symptoms were associated
with improved outcomes in patients with COVID-19.
Author contribution
MRT managed the manuscript, study design, controlling the project and
fulfilled the data processing and compiled some sections of the article. AM,
AB, HMK, SI, JK, SNS, FS, EBA
and HEK were involved in some sections of the manuscript like collected
data, data processing and performed statistical analyses. All authors revised
the article comprehensively and confirmed the final edited version of the paper
Conflict of interest
No potential conflict of interest was reported by the authors.
Acknowledgments
The authors express their appreciation to all people who
contributed to this manuscript.
References
1. Zhang S-f,
Tuo J-l, Huang X-b, Zhu X, Zhang D-m, Zhou K, et al. Epidemiology
characteristics of human coronaviruses in patients with respiratory infection
symptoms and phylogenetic analysis of HCoV-OC43 during 2010-2015 in Guangzhou.
PloS one. 2018;13(1):e0191789.
2. Tang
X, Zhang J, Zhang S, Wang P, Fan X, Li L, et al. Prevalence and genetic
diversity of coronaviruses in bats from China. Journal of virology.
2006;80(15):7481-90.
3. Fung
TS, Liu DX. Human coronavirus: host-pathogen interaction. Annual review of
microbiology. 2019;73:529-57.
4. Angeletti
S, Benvenuto D, Bianchi M, Giovanetti M, Pascarella S, Ciccozzi M. COVID‐2019:
the role of the nsp2 and nsp3 in its pathogenesis. Journal of medical virology.
2020;92(6):584-8.
5. Huang
C, Wang Y, Li X, Ren L, Zhao J, Hu Y, et al. Clinical features of patients
infected with 2019 novel coronavirus in Wuhan, China. The lancet.
2020;395(10223):497-506.
6. Salehi
S. abedi a, Balakrishnan S, gholamrezanezhad a. Coronavirus disease. 2019.
7. Tehrani
S, Killander A, Åstrand P, Jakobsson J, Gille-Johnson P. Risk factors for death
in adult COVID-19 patients: Frailty predicts fatal outcome in older patients.
International Journal of Infectious Diseases. 2021;102:415-21.
8. Docherty
AB, Harrison EM, Green CA, Hardwick HE, Pius R, Norman L, et al. Features of 20
133 UK patients in hospital with covid-19 using the ISARIC WHO Clinical
Characterisation Protocol: prospective observational cohort study. bmj.
2020;369.
9. Nikpouraghdam
M, Farahani AJ, Alishiri G, Heydari S, Ebrahimnia M, Samadinia H, et al.
Epidemiological characteristics of coronavirus disease 2019 (COVID-19) patients
in IRAN: A single center study. Journal of Clinical Virology. 2020;127:104378.
10. Novel
CPERE. The epidemiological characteristics of an outbreak of 2019 novel
coronavirus diseases (COVID-19) in China. Zhonghua liu xing bing xue za zhi=
Zhonghua liuxingbingxue zazhi. 2020;41(2):145.
11. Rate
C-F. Characteristics of Patients Dying in Relation to COVID-19 in Italy Onder
G, Rezza G, Brusaferro S. JAMA Published online March. 2020;23.
12. Hu Z,
Song C, Xu C, Jin G, Chen Y, Xu X, et al. Clinical characteristics of 24
asymptomatic infections with COVID-19 screened among close contacts in Nanjing,
China. Science China Life Sciences. 2020;63(5):706-11.
13. Shah C,
Grando DJ, Rainess RA, Ayad L, Gobran E, Benson P, et al. Factors associated
with increased mortality in hospitalized COVID-19 patients. Annals of Medicine
and Surgery. 2020;60:308-13.
14. Mehraeen
E, Karimi A, Barzegary A, Vahedi F, Afsahi AM, Dadras O, et al. Predictors of
mortality in patients with COVID-19–a systematic review. European journal of
integrative medicine. 2020:101226.
15. Channappanavar
R, Fett C, Mack M, Ten Eyck PP, Meyerholz DK, Perlman S. Sex-based differences
in susceptibility to severe acute respiratory syndrome coronavirus infection.
The Journal of Immunology. 2017;198(10):4046-53.
16. Jaillon
S, Berthenet K, Garlanda C. Sexual dimorphism in innate immunity. Clinical
reviews in allergy & immunology. 2019;56(3):308-21.
17. Bhopal
SS, Bhopal R. Sex differential in COVID-19 mortality varies markedly by age.
Lancet (London, England). 2020.
18. Yu C,
Lei Q, Li W, Wang X, Liu W, Fan X, et al. Clinical characteristics, associated
factors, and predicting COVID-19 mortality risk: a retrospective study in
Wuhan, China. American journal of preventive medicine. 2020;59(2):168-75.
19. Zhou F,
Yu T, Du R, Fan G, Liu Y, Liu Z, et al. 530 Y. Wei, H Li, X Wu, J Xu, S Tu, Y
Zhang, H Chen, B Cao, Clinical course and risk factors for mortality of adult
inpatients with COVID-19 in Wuhan, China: a retrospective cohort study, Lancet.
2020;395:1054-62.
20. Opal
SM, Girard TD, Ely EW. The immunopathogenesis of sepsis in elderly patients.
Clinical infectious diseases. 2005;41(Supplement_7):S504-S12.
21. Khan S,
McCabe M, Krefman A, Petito LC, Yang X, Kershaw K, et al. A county-level
susceptibility index and coronavirus disease 2019 mortality in the united
states: A socioecological study. medRxiv. 2020.
22. Zheng
Z, Peng F, Xu B, Zhao J, Liu H, Peng J, et al. Risk factors of critical &
mortal COVID-19 cases: A systematic literature review and meta-analysis.
Journal of Infection. 2020.
23. Pourbagheri-Sigaroodi
A, Bashash D, Fateh F, Abolghasemi H. Laboratory findings in COVID-19 diagnosis
and prognosis. Clinica Chimica Acta. 2020.
24. Yang J,
Zheng Y, Gou X, Pu K, Chen Z, Guo Q, et al. Prevalence of comorbidities in the
novel Wuhan coronavirus (COVID-19) infection: a systematic review and
meta-analysis. Int J Infect Dis. 2020;10.
25. Yan Q,
Zuo P, Cheng L, Li Y, Song K, Chen Y, et al. Acute kidney injury is associated
with in-hospital mortality in elderly patients with COVID-19. The Journals of
Gerontology: Series A. 2020.
26. Guan
W-j, Ni Z-y, Hu Y, Liang W-h, Ou C-q, He J-x, et al. Clinical characteristics
of coronavirus disease 2019 in China. New England journal of medicine.
2020;382(18):1708-20.
27. Su H,
Yang M, Wan C, Yi L-X, Tang F, Zhu H-Y, et al. Renal histopathological analysis
of 26 postmortem findings of patients with COVID-19 in China. Kidney
international. 2020;98(1):219-27.
28. Cheng
Y, Luo R, Wang K, Zhang M, Wang Z, Dong L, et al. Kidney disease is associated
with in-hospital death of patients with COVID-19. Kidney international.
2020;97(5):829-38.
29. Zhou
Y-J, Zheng KI, Wang X-B, Yan H-D, Sun Q-F, Pan K-H, et al. Younger patients
with MAFLD are at increased risk of severe COVID-19 illness: a multicenter
preliminary analysis. Journal of hepatology. 2020;73(3):719-21.
30. Guan
W-j, Liang W-h, Zhao Y, Liang H-r, Chen Z-s, Li Y-m, et al. Comorbidity and its
impact on 1590 patients with COVID-19 in China: a nationwide analysis. European
Respiratory Journal. 2020;55(5).
31. Shi S,
Qin M, Shen B, Cai Y, Liu T, Yang F, et al. Association of cardiac injury with
mortality in hospitalized patients with COVID-19 in Wuhan, China. JAMA
cardiology. 2020;5(7):802-10.
32. Yusuf
S, Joseph P, Rangarajan S, Islam S, Mente A, Hystad P, et al. Modifiable risk
factors, cardiovascular disease, and mortality in 155 722 individuals from 21
high-income, middle-income, and low-income countries (PURE): a prospective
cohort study. The Lancet. 2020;395(10226):795-808.
33. Hamming
I, Timens W, Bulthuis M, Lely A, Navis Gv, van Goor H. Tissue distribution of
ACE2 protein, the functional receptor for SARS coronavirus. A first step in
understanding SARS pathogenesis. The Journal of Pathology: A Journal of the
Pathological Society of Great Britain and Ireland. 2004;203(2):631-7.
34. Danser
AJ, Epstein M, Batlle D. Renin-angiotensin system blockers and the COVID-19
pandemic: at present there is no evidence to abandon renin-angiotensin system
blockers. Hypertension. 2020;75(6):1382-5.
35. Ssentongo
P, Ssentongo AE, Heilbrunn ES, Ba DM, Chinchilli VM. Association of
cardiovascular disease and 10 other pre-existing comorbidities with COVID-19
mortality: A systematic review and meta-analysis. PloS one.
2020;15(8):e0238215.
36. Yang X,
Yu Y, Xu J, Shu H, Liu H, Wu Y, et al. Clinical course and outcomes of
critically ill patients with SARS-CoV-2 pneumonia in Wuhan, China: a
single-centered, retrospective, observational study. The Lancet Respiratory
Medicine. 2020;8(5):475-81.
37. Yang J,
Feng Y, Yuan M, Yuan S, Fu H, Wu B, et al. Plasma glucose levels and diabetes
are independent predictors for mortality and morbidity in patients with SARS.
Diabetic medicine. 2006;23(6):623-8.
38. Prekker
ME, Brunsvold ME, Bohman JK, Fischer G, Gram KL, Litell JM, et al. Regional
planning for extracorporeal membrane oxygenation allocation during COVID-19.
Chest. 2020.
39. Wu Z,
McGoogan J. of and important lessons from the coronavirus disease 2019
(COVID-19) outbreak in China: summary of a report of 72314 cases from the
Chinese Center for Disease Control and Prevention. JAMA. 2020.
40. Tabatabaei
SMH, Rahimi H, Moghaddas F, Rajebi H. Predictive value of CT in the short-term
mortality of Coronavirus Disease 2019 (COVID-19) pneumonia in nonelderly
patients: A case-control study. European Journal of Radiology. 2020;132:109298.
41. Wong
HYF, Lam HYS, Fong AH-T, Leung ST, Chin TW-Y, Lo CSY, et al. Frequency and
distribution of chest radiographic findings in patients positive for COVID-19.
Radiology. 2020;296(2):E72-E8.