Nonalcoholic fatty
liver scoring panels shortcut for fibro scanning results or not
Saba Fakhrieh Asl 1†, Sara Dorosti 2†, Fariborz Mansour-Ghanaei 3,1,
Farahnaz Joukar 1, Sara Yeganeh 1,
Keyvan Aminian 4, Afshin Shafaghi 1*
1 GI Cancer Screening and Prevention Research Center, Guilan University of Medical Sciences, Rasht, Iran
2 Gastrointestinal & Liver Diseases Research Center, Guilan
University of Medical Sciences, Rasht, Iran
3 Caspian Digestive Diseases Research Center and GI Cancer Screening and
Prevention Research Center, Guilan University of
Medical Sciences, Rasht, Iran
4 Department of Forensic
Pathology, School of Medicine, Research Center for Gastroenterology and Liver
Diseases, Razi Hospital, Guilan University of Medical
Sciences, Rasht, Iran
† Equal contribution
Corresponding Authors: Afshin Shafaghi
* Email: Drafshinshafaghi@gmail.com
Abstract
Introduction: Liver steatosis has a wide range of conditions from simple steatosis
to non-alcoholic steatohepatitis, fibrosis, and eventually cirrhosis. Several
panels and scoring systems have been introduced to differentiate steatosis with
or without advanced fibrosis and also the degree of fibrosis. This study aimed to evaluate eleven different scoring panels in
patients with steatosis and compare their results with Fibro Scan.
Methods: The study was
performed on 122 NAFLD patients who were confirmed by ultrasound. The patients
were referred to the gastroenterologist in Razi hospital in the north of Iran
from September 2017 to April 2018. All patients underwent Fibro Scan. Multiple
scoring systems were calculated using the laboratory values. These results were
compared with the results of Fibro Scan. AUC for each panel was calculated.
Results: In This study, 62 (50.8%) were men. The mean age of the patients was
47.1±11.7 years. There were significant
differences between patients with or without advanced fibrosis in three panels
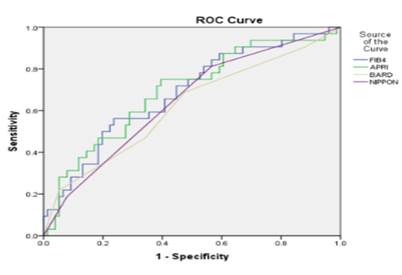
of APRI, NIPPON, and FIB4 (p=0.03, p=0.01, p=0.005, respectively). AUROC for
APRI, NIPPON, and FIB4 were, 0.695 (CI=0.58-0.8, p=0.001), 0.642 (CI: 0.5-0.74,
p=0.015) and 0.684 (CI: 0.5-0.7, p=0.002), respectively. None of the other
panels had enough sensitivity for the diagnosis of advanced fibrosis.
Conclusion: Given the cost-effectiveness of panels, their ease of calculation, and
noninvasiveness, FIB4, NIPPON and APRI can be used as useful tools for
following, and also for predicting progression to advanced fibrosis.
Keywords: Nonalcoholic Fatty Liver Disease, Scoring Panels, Predicting
Introduction
Non-alcoholic
fatty liver (NAFLD) is formed with the pathological accumulation of fat in the
liver (1) which is defined as the accumulation of fat in more than 5% of hepatocytes
(2). Over the past 3 decades, fatty liver has become one of the most important
chronic liver diseases in the world (3, 4). The highest prevalence of this
disease belongs to western countries (5, 6). The prevalence of NAFLD in Asia is
variable between 12-24 %. The prevalence of NAFLD is 2.9- 7.1% in Iran
(7). The incidence of fatty liver is
about 20 out of every 10,000 people per year. This disease has a wide range of
conditions from simple steatosis to non-alcoholic steatohepatitis, fibrosis, and
eventually cirrhosis and hepatocellular carcinoma (9).
Liver
biopsy is the gold standard method for evaluating inflammation and severity and
ranking fibrosis in NAFLD and non-alcoholic steatohepatitis (10). The biopsy is
an invasive and also a difficult procedure that is associated with pain, the
risk of complications, measurement errors, high cost, and the patient’s
unwillingness (11); therefore, the biopsy is not realistic for all NFLD
patients and it is impractical (12, 13).
Alternative
methods, and various tools for NAFLD are magnetic resonance imaging (MRI),
magnetic resonance spectroscopy (MRS), ultrasound (absence of steatosis only),
the enhanced liver fibrosis (ELF) score, transient elastography and NAFLD
fibrosis score (13). These methods have some limitations, thus non-invasive,
and reliable tests for this highly prevalent disease is important(14).
Several panels and scoring systems from a combination of laboratory and
clinical variables have been introduced to differentiate NAFLD with and without
advanced fibrosis and to determine the degree of liver fibrosis. Most of them,
to a large extent, have acceptable accuracy in distinguishing NAFLD with and
without advanced fibrosis (10, 15, 16).
Our
study aimed to evaluate 11 different scoring panels such as FIB4 [Age, AST,
ALT, Platelets], APRI [AST platelet ratio index], AAR [Age, ALT/AST ratio], NFS
[NAFLD fibrosis score], AP [Age, Platelets], BAAT [BMI, Age, ALT, TG] Score,
BARD [BMI, AST/ALT ratio, DM) score, PLALA [platelet, albumin, AST/ALT ratio]
score, N [Nippon]Score, FI [Platelets, Albumin], Forns
index [platelet count, GGT, Age, total cholesterol] in patients with NAFLD and compare their
results with Fibro Scan.
Methods
Patient
The sample size of this cross-sectional study was set as 122
patients. All patients with age 13-69 years were referred to the
gastroenterologist in Razi hospital in the north of Iran from September 2017 to
April 2018. The protocol of this study was approved by a local ethical
committee of Guilan University of Medical Sciences
(No. IR.GUMS.1396.114) and was based on the
Declaration of Helsinki. Informed consent was obtained from all patients and
all securities were applied to their data.
Inclusion criteria were patients with NAFLD confirmed by
ultrasound. People with viral hepatitis (hepatitis B and C), autoimmune
hepatitis, drug-induced liver disease, consumption of hepatotoxicity drugs
including glucocorticoid, methotrexate, amiodarone, isoniazid, and tamoxifen
during 6 months, consumption of vitamin E or glitazon,
primary biliary cirrhosis, sclerosing cholangitis, genetic, metabolic, and
cholestatic liver diseases, hemochromatosis, Wilson’s disease,
alpha-1-antitrypsin deficiency related to liver disease, recent or past alcohol
consumption of >21 standard drinks per week for men and >14 standard
drinks per week for women, past and present alcohol side effects, evidence of
HCC or liver cancers, and history of bariatric surgery were excluded.
Then, the patients underwent Fibro Scan (FibroScan;
Echosens, Paris, France) to determine the degree of
fibrosis (F0-F4) and steatosis (S1-S3) in the liver. All patients underwent
Fibro Scan by one expert person.
Clinical and biochemical
measurements
Clinical and biochemical parameters were assessed for each
participant. Underlying comorbidities including diabetes, hypertension,
dyslipidemia, hypothyroidism, and polycystic ovary syndrome (PCOS) were also
recorded. The history of pharmacotherapy for diabetes, hypertension,
hypothyroidism, dyslipidemia, and other drugs was also reviewed.
Laboratory tests including white blood cell (WBC), red blood cell
(RBC), hemoglobin (Hb), hematocrit (Hct), platelet (Plt),
aspartate transaminase (AST), alanine transaminase (ALT), total bilirubin,
direct bilirubin, alkaline phosphatase (ALP), lactate dehydrogenase (LDH),
triglycerides (TGs), high-density lipoprotein (HDL), low-density lipoprotein
(LDL), total cholesterol, albumin (Alb), ferritin, total iron-binding capacity
(TIBC), gamma-glutamyl transpeptidase (GGT), ceruloplasmin, transferrin
saturation, fasting blood glucose (FBS), and alpha-fetoprotein (AFP) were
checked.
Then the scores of multiple scoring systems including AAR, APRI,
FIB4, NFS, AP index, FI, Forms Index, BARD, BAAT, N Score, PLALA Score were
calculated using the laboratory values, and the diagnostic value of the
clinical indicators and the scoring systems was compared with the results of
Fibro Scan. To determine the diagnostic value of each panel, sensitivity,
specificity, positive predictive value (PPV), negative predictive value (NPV),
and diagnostic accuracy were calculated.
Statistical analysis
Information on patients was classified, and the demographic data
were analyzed in two groups with or without advanced fibrosis in SPSS 22. The
qualitative parameters were analyzed through the Chi-Square test and the quantitative
parameters through t-test in both groups. The results of Fibro Scan were
divided into two groups without fibrosis (F0)/with mild fibrosis equivalent
(F0F1) and advanced fibrosis (F2, F3, F3F4, and F4).
The results of the 11 panels were analyzed using a t-test in both
groups. In addition, considering the cutoff point, the results of each panel
were divided into two groups of no advanced fibrosis (no fibrosis or slight
fibrosis) and advanced fibrosis. These results were compared with the results
of Fibro Scan (no advanced fibrosis (F0 and F0F1) and advanced fibrosis (F2,
F3, F3F4, F4), and then sensitivity, specificity, PPV, NPV, and accuracy of
each panel were calculated. The area under the receiver operating
characteristic (AUROC) curve and the confidence interval were also calculated
for each panel. P-values less than 0.05 were considered significant. Finally,
sensitivity, specificity, PPV, NPV, and accuracy of all panels were compared
and the ROC curves of all panels were plotted on a single chart to compare the
AUROCs. The formula and cutoff point for each panel are as follows in Table 1.
In addition, AUC for each panel is shown in figure 1.
Figure 1. Comparison of the area under the ROC curve in panels with AUC
>0.6.
 Also, a
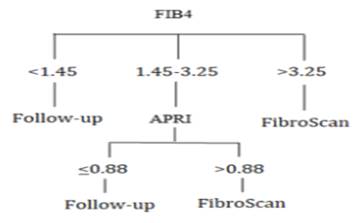
diagnostic algorithm for clinical use of these panels is presented in Figure 2.
Also, a
diagnostic algorithm for clinical use of these panels is presented in Figure 2.
Figure 2. Proposed diagnostic algorithm for patients with NAFLD.
Discussion
This
study aimed to compare the scoring panels of NAFLD with Fibro Scan. NAFLD is a
common liver disease that may progress to steatohepatitis and cirrhosis. The
liver biopsy is a gold standard but, invasive diagnostic procedure that is not
without flaws. Therefore, there has been increasing interest in identifying
non-invasive, surrogate diagnostic methods such as scoring panels and Fibro
Scan.
Scoring
panels can play an important role in the diagnosis of NAFLD along with Fibro
Scan. There was no significant age difference between the two groups of
patients with and without advanced fibrosis. However, in the study of Kessuko et al, Cichoz-Lach et al,
Ratziu et al, McPherson et al, and Mohamed et al, the
two groups had a significant age difference (17-21). In our study, there was no
significant difference in BMI between patients with advanced fibrosis and
patients without it, which is similar to the results of Kessuko
et al and McPherson et al and in contrast to the results of Ratziu
et al, A. Mohamed et al, and Cichoz-Lach et al
(17-20).
APRI
Panel
Sensitivity,
specificity, PPV, NPV, and accuracy of the APRI panel were 2.9%, 95%, 20%,
69.7%, and 67.5%, respectively, indicating that the panel has a low sensitivity
for the diagnosis of fibrosis, but high specificity of this panel with
relatively good NPV indicates its high strength in ruling out advanced
fibrosis. This panel was able to distinguish the two groups of the patient with
and without advanced fibrosis (p=0.03). In addition, by calculating the area
under the ROC curve, it was found that this panel had a relatively good
diagnostic value (AUROC=0.695, CI=0.58-0.8, p=0.001). The cutoff point
suggested by the ROC curve was 0.26 at which sensitivity and specificity were
73% and 62%, respectively.
According
to the study of Atay et al, sensitivity, specificity, PPV, and NPV of the APRI
panel at cutoff point of 0.61 were 35%, 95.7%, 85.7%, and 66.7%, respectively.
Atay et al, stated that this panel is useful for ruling out rather than
diagnosing advanced fibrosis (22). In a study by Shin et al on patients with
chronic liver disease, sensitivity, specificity, PPV, and NPV of this panel
were 93%, 48%, 75%, and 80% at the cutoff point of 0.5, and sensitivity,
specificity, and PPV were 58%, 88% and 89% at the cutoff point of 1.5,
respectively (23). In a study by Kruger et al, sensitivity, specificity, PPV,
and NPV were 75%, 86%, 54%, 93%, respectively, at the cutoff point of 0.95
(24). While, in the study of Sumida et al, sensitivity, specificity, PPV, and
NPV were 67%, 81%, 31%, and 95%, respectively (25). A cohort study showed that
sensitivity and specificity of APRI score was 30 % and 92.8 % respectively (26).
Similar
to the study of Mohamed, et al (p=0.001), the present study found a significant
difference between two groups of patients with and without advanced fibrosis.
In the study of Mohamed et al, sensitivity, specificity, PPV, NPV, accuracy,
and AUROC were 21.1%, 93%, 50%, 77.9%, 75%, and 0.907, respectively, at the
cutoff point of 1 (95%CI: 0.839- 0.974). It was also stated that if the liver
biopsy was considered only for individuals with a panel score of 1, 89.4% of
unnecessary biopsies would be avoided (20). According to Macpherson’s et al
study, sensitivity, specificity, PPV, and NPV were 27%, 89%, 37%, and 84%,
respectively, and AUROC was 0.67 at the cutoff point of 1 (95%CI: 0.54-0.8).
Given that the NPV of this panel is suitable for ruling out advanced fibrosis.
According to this study, the weak PPV of the panel indicates that it cannot
replace liver biopsy (19). These were reported in the French cohort study as
66%, 90%, 72%, and 87%, respectively (27). The results of the Peres-Gutieierrez et al, were similar to those of McPherson et
al, study (19, 28). According to Ding’s study, AUROC was 0.795 and sensitivity,
specificity, PPV, NPV, and accuracy were 80%, 73%, 33%, 96%, and 65%,
respectively (29). According to the study of Rath et al, sensitivity,
specificity, PPV, NPV, and AUROC were 29.1%, 97.22%, 87.5%, 83.3%, and 0.36,
respectively (10).
Similar
to the results of Atay et al, and Rath et al, regarding the APRI panel,
sensitivity was low and specificity was high in this study; sensitivity was
much lower in our study than those studies (10, 22). On the other hand, there
was a significant difference between the two groups of patients with and
without advanced fibrosis; therefore, the low sensitivity of this panel may be
attributed to the improper cutoff point. This cutoff point cannot properly
diagnose patients with advanced fibrosis, but it can rule it out well.
Therefore, using the ROC curve, 0.26 was selected as the cutoff point for the
APRI panel in our study population. Assuming a new cutoff point for this panel,
sensitivity and specificity were obtained 73% and 62%, respectively. As AST level
in the group with advanced fibrosis was significantly higher than the other
group (p=0.03), the significant difference between the two groups in the APRI
panel is justifiable. But in general, given the low sensitivity and high
specificity of the APRI panel, it is more useful to rule out than to diagnose
advanced fibrosis.
NIPPON
panel
Sensitivity,
specificity, PPV, NPV, and accuracy of this panel were 35.3%, 78.4%, 38.7%,
75.8%, and 66.3%, respectively. This panel was able to make a significant
difference between the two groups of patients with and without advanced
fibrosis (p=0.01) (Table 4).
In
addition, the area under the ROC curve showed that this panel had a good
diagnostic value (AUROC=0.642, CI: 0.5-0.74, p=0.015). A limited number of
studies have been performed on this panel. In a study by Sumida et al, this
panel differentiated the groups of patients with and without advanced fibrosis
(p<0.0001). The AUROC of this panel was 0.715 and sensitivity, specificity,
PPV, and NPV were 80%, 58%, 19%, 96%, respectively. It was also stated that
this panel can prevent 53% of unnecessary biopsies (25). Considering that
diabetes was a parameter involved in this panel and also diabetes was
differentiated in the two groups of patients with and without advanced fibrosis
in this study (p=0), we could justify the ability of this panel to
differentiate between these two groups.
FIB4
panel
Sensitivity,
specificity, PPV, NPV and accuracy of this panel were 21.2%, 92.5%, 35%, 74%,
and 71.6%, at the cutoff point of 1.45 and 0, 100%, 0, 70.7%and 70.7% at the
cut point of 3.25, respectively.
This
panel was able to significantly differentiate the two groups of patients with
and without advanced fibrosis (p=0.005). In addition, the area under the ROC
curve indicated that this panel has a good predictive value (AUROC=0.684, CI:
0.5-0.7, p=0.002). According to the ROC curve, the panel sensitivity and
specificity will be 75% and 53% at the cutoff point of 0.82.
In
the study of Atay et al, sensitivity, specificity, PPV, and NPV were 65%,
69.6%, 61.1%, and 72.7% at the cutoff point of 1.08, respectively. They stated
that this panel has moderate sensitivity and specificity (22).
In a
study by Shah et al, sensitivity, specificity, PPV, and NPV were 74%, 71%, 43%,
and 90% at the cutoff point of 1.3 and 33%, 98%, 80%, and 83% at the cut point
of 2.67, respectively (30). Sensitivity, specificity, PPV, and NPV in the study
of Sumida et al, were 90%, 64%, 24%, and 98% at the cutoff point of 1.45,
respectively. In addition, based on the ROC curve, sensitivity, specificity,
PPV, and NPV were 48%, 95%, 53%, and 94% at the cutoff point of 3.25 in this
study
(25).
In
the study of Mohamed et al, sensitivity, specificity, PPV, and NPV were 84.2%,
86.9%, 66.6%, and 94.2% at the cutoff point of 1.3 and 63.2%, 93%, 75%, and
88.3% at the cutoff point of 2.6, respectively. The accuracy and AUROC of this
panel were 89.7 and 0.936 (95%CI: 0.884-0.898). The FIB4 panel was able to
differentiate the two groups of patients with and without advanced fibrosis
(p<0.001). It was also stated that this panel can prevent 68% of unnecessary
biopsies at levels less than 1.3, and that it is suitable for both ruling out
and diagnosis of advanced liver fibrosis [16]. In the study of McPherson et al,
the FIB4 panel was able to differentiate the groups of patients with and
without advanced fibrosis (p<0.001). In Cheah et al study FIB4 was introduced
as available parameters to identify fibrosis (6). AUROC for this panel was 0.86
(95%CI: 0.78- 0.94) and sensitivity, specificity, PPV, and NPV were 85%, 65%,
36%, and 95% at the cutoff point of 1.3 and 26%, 98%, 75%, and 85% at the
cutoff point of 3.25, respectively. It was also stated that this panel can
prevent 62% of unnecessary biopsies at levels less than 1.3, that this panel
can rule out advanced fibrosis and its use can reduce unnecessary biopsy for
people with mild fibrosis (19).
The
panel’s ability to differentiate the two groups of patients with and without
advanced fibrosis and its good AUROC indicates the acceptable diagnostic power
of this panel in the study population. Despite the panel’s low sensitivity, its
high specificity indicates that it can rule out rather than detecting advanced
fibrosis.
In
general, none of the panels had enough sensitivity for the diagnosis of
advanced fibrosis. Given their relatively good specificity, these panels are
generally better to rule out rather than to diagnose advanced fibrosis by
comparison of the panels’ diagnostic power (Table 5), the APRI and FIB4 panels
are introduced as panels with high diagnostic power.
Conclusion
We
concluded that the FIB4 panel is calculated first for the patient with NAFLD.
For values less than 1.45, it is recommended to follow-up patients with other
tests and examinations; for values greater than 3.25, it is recommended to
perform more detailed investigations through Fibro Scan; and for values between
1.45 and 3.25, it is recommended to measure the APRI panel; in this regard,
cases with APRI values of <0.88 and >0.88 are recommended to follow-up
and perform Fibro Scan, respectively. Given the cost-effectiveness of these
panels, their ease of calculation, and noninvasiveness, they can be used as
useful tools for following up the patients and also for predicting progression
to advanced fibrosis. It is recommended to develop a new and more accurate
index for clinical use, based on the criteria of the three panels of FIB4,
APRI, and NIPPON, and perform further studies on these panels. As a limitation
of this study, the results of Fibro Scan were considered as the standard
method, while the biopsy was the gold standard in other studies; this has
somewhat diminished the accuracy of this study.
Acknowledgements
The
authors wish to thanks, all staff of the Gastrointestinal and Liver Diseases
Research Center affiliated to the Guilan University
of Medical Sciences for their kindly help in all steps of this study.
Author contributions
Conception
and design: FMGh, ASh;
analysis and interpretation of the data: FJ, SD, SY, SFA;formal analysis: FJ,
ASh; drafting of the article: FJ, SD,
SY, SFA; critical revision of the article for important
intellectual content: FJ, ASh; KA
project administration: FMGh, FJ, SFA;
final approval of the article: ASh, FJ,
SFA. All authors approved its final version and agreed to be
accountable for all aspects of the study.
Funding
The
funders had no role in the study design, data collection, and analysis,
decision to publish, or preparation of the manuscript.
Ethical approval and consent
to participate
This
study was registered in the Research Department of Guilan
University of Medical Sciences with the ethics code of IR.GUMS.1396.114.
This manuscript has not been published in whole or in part. All authors have
read the manuscript and have agreed that the work is ready for submission and
accept responsibility for its contents. Before participation, all participants
received oral and written study information and signed a written consent form.
Competing of interest
None
to declare.
References
1. Lotfi K, Nouri M,
Askari G. The Effect of Resveratrol Supplementation on Improving Non-Alcoholic
Fatty Liver: A Review on Randomized Clinical Trials. Clinical Excellence.
2020;9(4):11-22.
2. EASL-EASD-EASO Clinical Practice Guidelines
for the Management of Non-Alcoholic Fatty Liver Disease. Obesity facts.
2016;9(2):65-90.
3. Younossi Z, Tacke F, Arrese M, Chander
Sharma B, Mostafa I, Bugianesi E, et al. Global perspectives on nonalcoholic
fatty liver disease and nonalcoholic steatohepatitis. Hepatology (Baltimore,
Md). 2019;69(6):2672-82.
4. Younossi Z, Anstee QM, Marietti M, Hardy T,
Henry L, Eslam M, et al. Global burden of NAFLD and NASH: trends, predictions,
risk factors and prevention. Nature reviews Gastroenterology & hepatology.
2018;15(1):11-20.
5. Younossi ZM, Koenig AB, Abdelatif D, Fazel
Y, Henry L, Wymer M. Global epidemiology of nonalcoholic fatty liver
disease—meta‐analytic assessment of prevalence, incidence, and outcomes.
Hepatology (Baltimore, Md). 2016;64(1):73-84.
6. Cheah MC, McCullough AJ, Goh GB-B. Current
modalities of fibrosis assessment in non-alcoholic fatty liver disease. Journal
of clinical and translational hepatology. 2017;5(3):261.
7. BAGHERI LK, GHAFFARPASAND F, MAHMOODI M,
LOTFI M, ZAMIRI N, HEYDARI ST, et al. Non alcoholic fatty liver disease in
southern Iran: A population based study. 2013.
8. Barikani A, Pashaeypoor S. Lifestyle in
non-alcoholic fatty liver: A review. Iranian Journal of Nursing Research.
2019;13(6):39-47.
9. Nikroo H, Mohammadian M, Nematy M, Sima HR,
Attarzadeh Hosseini SR. The effect of diet and exercise on improvement of
quality of life in patients with nonalcoholic steatohepatitis. Journal of
Kerman University of Medical Sciences. 2014;21(1):61-72.
10. Rath MM, Panigrahi MK, Pattnaik K, Bhuyan P,
Kar SK, Misra B, et al. Histological evaluation of non-alcoholic fatty liver
disease and its correlation with different noninvasive scoring systems with
special reference to fibrosis: a single center experience. Journal of clinical
and experimental hepatology. 2016;6(4):291-6.
11. Sumida Y, Nakajima A, Itoh Y. Limitations of
liver biopsy and non-invasive diagnostic tests for the diagnosis of
nonalcoholic fatty liver disease/nonalcoholic steatohepatitis. World journal of
gastroenterology: WJG. 2014;20(2):475.
12. Patel K, Sebastiani G. Limitations of
non-invasive tests for assessment of liver fibrosis. JHEP Reports.
2020;2(2):100067.
13. UK NGC. Non-alcoholic fatty liver disease:
assessment and management. 2016.
14. Wai C-T, Greenson JK, Fontana RJ, Kalbfleisch
JD, Marrero JA, Conjeevaram HS, et al. A simple noninvasive index can predict
both significant fibrosis and cirrhosis in patients with chronic hepatitis C.
Hepatology (Baltimore, Md). 2003;38(2):518-26.
15. Angulo P, Bugianesi E, Bjornsson ES,
Charatcharoenwitthaya P, Mills PR, Barrera F, et al. Simple noninvasive systems
predict long-term outcomes of patients with nonalcoholic fatty liver disease.
Gastroenterology. 2013;145(4):782-9. e4.
16. Alkhouri N, Mansoor S, Giammaria P, Liccardo
D, Lopez R, Nobili V. The development of the pediatric NAFLD fibrosis score
(PNFS) to predict the presence of advanced fibrosis in children with
nonalcoholic fatty liver disease. PloS one. 2014;9(8):e104558.
17. Cichoż-Lach H, Celiński K, Prozorow-Król B,
Swatek J, Słomka M, Lach T. The BARD score and the NAFLD fibrosis score in the
assessment of advanced liver fibrosis in nonalcoholic fatty liver disease.
Medical science monitor: international medical journal of experimental and
clinical research. 2012;18(12):CR735.
18. Kessoku T, Ogawa Y, Yoneda M, Imajo K, Sumida
Y, Eguchi Y, et al. Simple scoring system for predicting cirrhosis in
nonalcoholic fatty liver disease. World Journal of Gastroenterology: WJG.
2014;20(29):10108.
19. McPherson S, Stewart SF, Henderson E, Burt
AD, Day CP. Simple non-invasive fibrosis scoring systems can reliably exclude
advanced fibrosis in patients with non-alcoholic fatty liver disease. Gut.
2010;59(9):1265-9.
20. Mohamed RA, Nabih MI, ElShobaky MB, Khattab
HM. The value of noninvasive scoring systems for the diagnosis of advanced
fibrosis in Egyptian patients with nonalcoholic fatty liver disease. The
Egyptian Journal of Internal Medicine. 2014;26(4):162-9.
21. Ratziu V, Charlotte F, Heurtier A, Gombert S,
Giral P, Bruckert E, et al. Sampling variability of liver biopsy in
nonalcoholic fatty liver disease. Gastroenterology. 2005;128(7):1898-906.
22. Atay K, Canbakan B, Alan O, Koroglu E, HATEMİ
Aİ, Kepil N, et al. Evaluation of non-invasive diagnostic methods as indicators
of fibrosis in patients with nonalcoholic fatty liver disease. 2017.
23. Shin WG, Park SH, Jun S-Y, Jung JO, Moon JH,
Kim JP, et al. Simple tests to predict hepatic fibrosis in nonalcoholic chronic
liver diseases. Gut and Liver. 2007;1(2):145.
24. Kruger FC, Daniels CR, Kidd M, Swart G,
Brundyn K, Van Rensburg C, et al. APRI: a simple bedside marker for advanced
fibrosis that can avoid liver biopsy in patients with NAFLD/NASH. South African
Medical Journal. 2011;101(7):477-80.
25. Sumida Y, Yoneda M, Hyogo H, Yamaguchi K, Ono
M, Fujii H, et al. Japan Study Group of Nonalcoholic Fatty Liver Disease
(JSG-NAFLD) A simple clinical scoring system using ferritin, fasting insulin,
and type IV collagen 7S for predicting steatohepatitis in nonalcoholic fatty
liver disease. Journal of gastroenterology. 2011;46:257-68.
26. Imai N, Imai Y, Kido Y. Psychosocial factors
that aggravate the symptoms of sick house syndrome in Japan. Nursing &
health sciences. 2008;10(2):101-9.
27. Calès P, Lainé F, Boursier J, Deugnier Y,
Moal V, Oberti F, et al. Comparison of blood tests for liver fibrosis specific
or not to NAFLD. Journal of hepatology. 2009;50(1):165-73.
28. Pérez-Gutiérrez OZ, Hernández-Rocha C,
Candia-Balboa RA, Arrese MA, Benítez C, Brizuela-Alcántara DC, et al.
Validation study of systems for noninvasive diagnosis of fibrosis in
nonalcoholic fatty liver disease in Latin population. Annals of hepatology. 2013;12(3):416-24.
29. Ding D, Li H, Liu P, Chen L, Kang J, Zhang Y,
et al. FibroScan, aspartate aminotransferase and alanine aminotransferase ratio
(AAR), aspartate aminotransferase to platelet ratio index (APRI), fibrosis
index based on the 4 factor (FIB-4), and their combinations in the assessment
of liver fibrosis in patients with hepatitis B. International journal of
clinical and experimental medicine. 2015;8(11):20876.
30. Shah AG, Lydecker A, Murray K, Tetri BN,
Contos MJ, Sanyal AJ, et al. Comparison of noninvasive markers of fibrosis in
patients with nonalcoholic fatty liver disease. Clinical gastroenterology and
hepatology. 2009;7(10):1104-12.