Platelet
count/spleen diameter ratio for the non-invasive diagnosis of esophageal
varices in Iranian patients with cirrhosis
Seyed-Kazem Hosseini-Ghaziani 1, Afshin Shafaghi 1, Farahnaz Joukar
1, Negin Letafatkar 1, Arman
Habibi 1, Saman Maroufizadeh 2,
Saba Fakhrieh Asl 1*
1 Gastrointestinal and Liver Disease
Research Center, Guilan University of Medical
Sciences, Rasht, Iran
2 Department of Biostatistics, School
of Health, Guilan University of Medical Sciences,
Rasht, Iran
Corresponding Authors: Saba Fakhrieh Asl
* Email: sfakhrieh@yahoo.com
Abstract
Introduction: Esophageal varices (EVs) carry a significant risk of rupture and
subsequent life-threatening bleeding. While previous research has investigated
the effectiveness of the platelet count to spleen diameter ratio (PC/SD) as a
non-invasive predictor of EVs in various populations, this study specifically
focuses on the Iranian population to assess the applicability and effectiveness
of this parameter in this region.
Materials and Methods: Upper gastrointestinal endoscopy was performed on 147 cirrhotic
patients to screen for EVs. Biochemical tests and ultrasonography were done to
measure spleen diameter (SD) and calculate the PC/SD ratio. ROC analysis was
done to determine the predictive performance of the parameters.
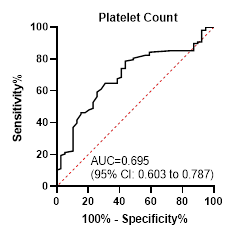
Results: Among the patients, 73% had EVs. The analysis showed the following:
platelet count (PC) had an AUC of 0.695 with 78.7% sensitivity and 56.4%
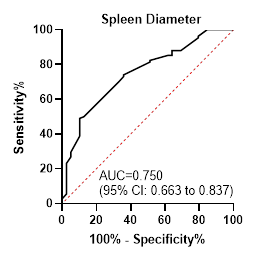
specificity; SD had an AUC of 0.750 with 49.1% sensitivity and 89.7%
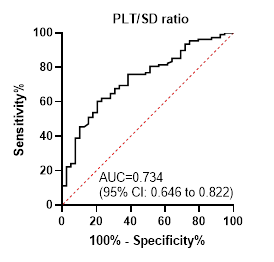
specificity; and the PC/SD ratio had an AUC of 0.734 with 60.2% sensitivity and
79.5% specificity. The PC/SD ratio exhibited a high positive predictive value
of 93% but a low negative predictive value of 41.9%. Optimal cutoff values were
determined as follows: PC≤ 100,000, SD< 163, and PC/SD ratio≤ 523.
Conclusion: By identifying high-risk patients who may benefit from targeted
endoscopic screening, this non-invasive method could contribute to improving
overall patient care and reducing the need for invasive procedures. However,
due to suboptimal performance results, it is crucial to use this approach with
caution, as endoscopic screening remains the standard practice for the
diagnosis and management of esophageal varices.
Keywords: Platelet count, Spleen diameter, Platelet count/spleen diameter ratio,
Hepatic cirrhosis, Esophageal varices
Introduction
Portal
hypertension, a consequence of chronic liver disease and cirrhosis, represents
a significant clinical challenge, with the development of esophageal varices
(EV) being one of its most serious complications (1, 2). EVs are
abnormally dilated veins in the lower portion of the esophagus, and their
rupture can lead to life-threatening variceal bleeding, a primary factor
contributing to morbidity and death in cirrhotic patients (3, 4).
Epidemiological
studies have reported that the prevalence of EVs in cirrhotic patients can
range from 60% to 80%, depending on the underlying etiology and severity of the
liver disease. Furthermore, among patients with established EVs, the annual
risk of experiencing a first episode of bleeding is estimated to be 10% to 15%,
with a mortality rate as high as 20% associated with this event (5).
The
gold standard for diagnosing EVs is upper endoscopy, which enables direct
inspection and grading of the varices (6). However, this
invasive procedure requires specialized equipment and skilled personnel,
potentially limiting its accessibility and cost-effectiveness, especially in
resource-constrained healthcare settings (5, 7).
In
order to address these issues, scientists have looked into the use of
non-invasive techniques to determine high-risk cirrhotic patients who would
most benefit from targeted endoscopic screening. One such approach is the
Platelet Count/Spleen Diameter (PC/SD) ratio, which has been proposed as a
reliable predictor of the presence and severity of EVs (7-10). This simple,
cost-effective, and easily obtainable parameter has the potential to optimize
resource allocation and improve access to necessary care for cirrhotic
patients.
However,
it is important to note that the performance of predictive models, such as the
PC/SD ratio, may vary across different populations due to factors like
underlying disease etiology, genetic differences, and environmental influences (10). Therefore, it
is crucial to assess the clinical utility of these non-invasive diagnostic
tools in particular populations, such as the Iranian population in this study,
to ensure their validity and clinical utility.
In
light of the aforementioned situation, the current investigation was carried
out to explore the correlation between platelet count (PC), spleen diameter
(SD), and their ratio (PC/SD) in cirrhotic patients within the Iranian
population. By focusing on this unique group, we seek to determine how
effectively the PC/SD ratio functions in different healthcare settings and
geographic regions. Our goal is to establish a non-invasive, cost-effective
tool that can enhance early detection and improve patient management strategies
in local healthcare environments.
Methods
Study
Design and Population
This
analytical cross-sectional study was conducted at Razi Hospital, a tertiary
care center in the north of Iran, Rasht city. The study population comprised
cirrhotic patients referred to the gastroenterology department at the study
site between September 15, 2023, and March 15, 2024. A combination of clinical,
laboratory, and imaging results led to the diagnosis of cirrhosis in the
patients and all adult individuals with a confirmed diagnosis of cirrhosis,
regardless of the underlying etiology, were included. However, patients
diagnosed with acute liver failure, those requiring urgent liver
transplantation, pregnant women, and individuals unable or unwilling to comply
with study procedures were excluded from this study.
Data
Collection
A
thorough clinical evaluation that included a physical examination, a medical
history, and laboratory testing was performed on each recruited individual. The
age, sex, and marital status of the participants were documented. As part of
the study protocol, the PC was measured for each participant and reported in
the unit of × 10^9/L. All participants underwent abdominal ultrasonography,
performed by an expert radiologist. The bipolar diameter of the spleen was
precisely measured and recorded in millimeters (mm). Also, an experienced
gastroenterologist performed upper endoscopy. The presence of EVs was
meticulously assessed and documented. The ratio of PC to SD was computed by
dividing the PC (× 10^9/L) by the SD (mm) measured during the abdominal
ultrasonography.
Statistical
Analysis
When
applicable, the mean ± standard deviation or median (interquartile range) were
used to express continuous variables. Frequencies and percentages were used to
display the categorical variables. To assess the normality of the key variables
(PC, SD, and PC/SD ratio), the Kolmogorov-Smirnov test was used. This informed
the choice of appropriate statistical tests for the subsequent analyses. The
Mann-Whitney test, a non-parametric method, was used to compare the values of
PC, SD, and their ratio between participants with and without EVs. This test
was chosen due to the non-normal distribution of the variables. The diagnostic
efficacy of PC, SD, and PC/SD ratio in predicting the presence of EVs was
evaluated with the use of receiver operating characteristic (ROC) curve
analysis. Youden's J index was used to identify the ideal cut-off values, and
the resulting sensitivity, specificity, positive predictive value (PPV), and
negative predictive value (NPV) were computed. The data analyses were conducted
using SPSS version 16, MedCalc Version 19.5.3, and
GraphPad Prism version 8.0.1 software. The significance level was set at 0.05.
Results
The
study included a total of 147 patients diagnosed with cirrhosis. The mean age
of participants was 56.18 ± 11.98 years, with 16 patients (10.9%) being older
than 70 years. The majority of the study population was male (61.9%) and
married (77.6%). The average duration of the disease among the participants was
3.31 ± 1.93 years, and 43 patients (29.3%) had a disease duration of more than
four years (Table 1).
The
most frequent underlying causes for cirrhosis were non-alcoholic
steatohepatitis (NASH) (23.8%), hepatitis C virus (HCV) (19.7%), and
alcohol-related (17.0%) liver disease. Based on the Child-Pugh classification,
31 patients (21.1%) were categorized as Class A, 81 (55.1%) as Class B, and 35
(23.8%) as Class C. EVs were discovered in 108 (73.5%) of the 147 patients
during endoscopic screening. Interestingly, the study found that the average
duration of cirrhosis was significantly longer in patients with EVs compared to
those without (p<0.001). While the group with EVs had a larger percentage of
women (65.7%) than the group without EVs (51.3%), the difference in percentages
between the two groups was not statistically significant (p=0.111) (Table 2).
Table
1. Demographic
and clinical characteristics of patients with cirrhosis presenting to the Razi
Hospital of Rasht in 2023.
|
Variable
|
Total (n=147)
|
with EVs (n=108)
|
without EVs (n=39)
|
P value
|
|
Age (year)
|
|
|
|
|
|
50 ≥
|
48 (32.7)
|
|
|
|
|
50-70
|
83 (56.5)
|
|
|
|
|
70 <
|
16 (10.9)
|
|
|
|
|
Mean (SD)
|
56.18 (11.98)
|
56.62 (11.65)
|
54.95 (12.93)
|
0.457
|
|
Sex
|
|
|
|
|
|
Male
|
91 (61.9)
|
37 (34.3)
|
19 (48.7)
|
0.111
|
|
Female
|
56 (38.1)
|
71 (65.7)
|
20 (51.3)
|
|
|
Marital Status
|
|
|
|
|
|
Single
|
33 (22.4)
|
19 (17.6)
|
14 (35.9)
|
0.019
|
|
Married
|
114 (77.6)
|
89 (82.4)
|
25 (64.1)
|
|
|
Duration of disease
(year)
|
|
|
|
|
|
2 ≥
|
59 (40.1)
|
|
|
|
|
3-4
|
45 (30.6)
|
|
|
|
|
4 <
|
43 (29.3)
|
|
|
|
|
Mean (SD)
|
3.31 (1.93)
|
3.64 (1.91)
|
2.38 (1.68)
|
0.001>
|
Table
2. Comparison
of platelet count (PC), spleen diameter (SD), and platelet count to spleen
diameter (PC/SD) ratio between individuals with and without esophageal varices
in patients with cirrhosis.
|
Variable
|
Total
(N=147)
|
Individuals without EVs
(N=39)
|
Individuals with EVs
(N=108)
|
P value
|
|
PC (n/mm3)
|
85000 (69000-105000)
|
105000 (83000
- 113000)
|
81000 (65250
- 96000)
|
0.001>
|
|
SD (mm)
|
160 (150-175)
|
155 (130 - 160)
|
162 (155 - 180)
|
0.001>
|
|
PC/SD ratio
|
533.7
(418.2-687.5)
|
652 (550 -
942)
|
484 (389 -
625)
|
0.001>
|
The
following is the determination of the ideal cut-off values: PC > 100,000
(sensitivity 78.7%, specificity 56.4%), SD < 163 mm (sensitivity 49.1%,
specificity 89.7%), and PC/SD ratio ≥ 523 (sensitivity 60.2%, specificity
79.5%).
Patients
with a PC/SD ratio below the cut-off value of 523, a PC below the cut-off of
100,000, and an SD above the cut-off of 163 mm were more likely to have EVs.
The PPV of these cut-off values were 89%, 83.3%, and 93%, respectively (Table
3).
Table
3. The
best cut-off points of platelet count, spleen diameter, and platelet count to
spleen diameter ratio in the diagnosis of esophageal varices.
|
|
PC (n/mm3)
|
SD (mm)
|
PC/SD ratio
|
|
Area under curve
|
0.695
|
0.750
|
0.734
|
|
Best cutoff point
|
≥ 100000
|
< 163
|
≥ 523
|
|
Sensitivity
|
78.7
|
49.1
|
60.2
|
|
specificity
|
56.4
|
89.7
|
79.5
|
|
Positive predictive value
|
83.3
|
93.0
|
89.0
|
|
Negative predictive value
|
48.9
|
38.9
|
41.9
|
|
Positive likelihood value
|
1.81
|
4.78
|
2.93
|
|
Negative likelihood value
|
0.38
|
0.57
|
0.50
|
Discussion
The
present investigation aimed to evaluate the prevalence of EVs among cirrhotic
patients and assess the utility of PC, SD, and the PC/SD ratio in predicting
the presence of EVs. The study found that 108 (73.5%) of the 147 participants
had EVs. According to the study results, cirrhotic individuals with EVs had
considerably smaller PC, greater SD, and lower PC/SD ratios than those without
EVs. Furthermore, the diagnostic utility of these parameters in predicting EVs
was assessed using ROC analysis.
The
prevalence of EVs in this study was consistent with those from other areas,
such as southern India (77.7%), Mexico (80.2%), and China (74.7%) (10-12). However,
lower prevalence rates were reported in studies conducted in Tanzania (39.5%)
and South Carolina (51%) (13, 14). This
variation in the occurrence of EVs across different patient populations could
be attributed, in part, to differences in the underlying causes of liver
cirrhosis. For instance, patients with biliary cirrhosis exhibited a lower
prevalence of EVs (26.0%), while those with hepatitis B-related liver cirrhosis
had a considerably higher rate (74.7%) (12, 15).
The
results of the present investigation suggest that SD may represent a more
reliable individual non-invasive marker for the prediction of EVs compared to
PC or the PC/SD ratio in the study population, as evidenced by the AUROC values
reported herein. These findings contrast with the conclusions of certain prior
studies, which have proposed the PC/SD ratio as a more accurate non-invasive
marker relative to PC or SD individually (8, 9).
The
predictive power of the PC/SD ratio in the current study was satisfactory but
not optimal. However, a number of previous investigations have documented
higher discriminative ability of this marker (5, 16-18). Specifically,
Giannini et al., who first introduced the PC/SD ratio as a promising
non-invasive tool, reported an AUROC of 0.86 in predicting the presence of EVs (17). Similarly,
Patil et al. observed an AUROC of 0.84 for the PC/SD ratio, a value exceeding
that obtained in the present investigation (18).
The
differences in the diagnostic utility of these non-invasive markers for
predicting EVs across studies can be attributed to several factors. Firstly,
the study populations may have varied in terms of the underlying etiologies of
cirrhosis, disease severity, and the prevalence of EVs. Secondly, the cut-off
values used for PC, SD, and PC/SD ratio varied across studies, which can affect
the sensitivity and specificity of these parameters in predicting the presence
of EVs. Furthermore, the discrepancies observed in the diagnostic performance
of these non-invasive parameters may be partially attributed to the influence
small sample size of this study.
Despite
the mixed findings, the present study demonstrated that the PC/SD ratio had a
high PPV of 93%, indicating that patients with a ratio below the cut-off are
highly likely to have EVs. However, the relatively low NPV of 41.9% suggests
that a ratio above the cut-off may not accurately exclude the presence of EVs.
This
emphasizes the potential utility of the PC/SD ratio as a screening tool for
identifying high-risk patients. By employing this method, healthcare providers
can effectively stratify patients according to their risk levels, facilitating
a more focused approach to endoscopic screening and monitoring. This
prioritization is crucial, as it enables clinicians to concentrate their
resources and efforts on individuals who are most likely to benefit from early
intervention.
The
ability of a non-invasive predictor to accurately identify high-risk patients
can help prevent serious complications, such as variceal hemorrhage, which is
vital in managing conditions like cirrhosis. Early intervention not only
enhances patient outcomes by averting adverse events but also improves the
overall quality of care provided.
Moreover,
this targeted approach contributes to the efficient allocation of healthcare
resources. By ensuring that high-risk individuals receive timely care,
healthcare systems can minimize unnecessary procedures for patients at lower
risk, thereby alleviating the burden on medical facilities and personnel. This
efficiency is particularly important in environments where healthcare resources
are constrained, as it allows for better management of patient loads and
enhances the overall effectiveness of the healthcare system.
It
is imperative to acknowledge that although the PC/SD ratio exhibits potential
as a non-invasive marker for predicting EVs and can assist in prioritizing
patients for endoscopy, it is crucial to emphasize that it cannot replace
traditional endoscopic procedures. Although previous studies have reported a
high predictive ability for this marker (5, 16-18), our findings
did not achieve that level of performance, indicating that its effectiveness
was not optimal in this context. Therefore, the use of the PC/SD ratio should
be approached with caution until sufficient evidence supports their efficacy.
The
most reliable method for identifying EVs and determining their severity is
still endoscopy, as it allows for direct visualization and grading of the
varices (19).
In
addition to the PC/SD ratio, other non-invasive indicators have been explored
for the prediction of EVs in cirrhotic patients, such as various serum
biomarkers (20-22). The
combination of these biomarkers with the PC/SD ratio may further improve the
diagnostic accuracy in predicting the presence of EVs, and this should be
investigated in future studies.
The
current research has certain limitations. Firstly, the fact that the study was
limited to a single tertiary care facility may limit the applicability of the
findings in other contexts. Secondly, the cross-sectional design of the study
precluded the assessment of the long-term predictive value of the PC/SD ratio
in identifying the development or progression of EVs. Prospective longitudinal
studies would be valuable in evaluating the utility of the PC/SD ratio for
monitoring the risk of EVs over time.
Conclusion
In
conclusion, the present study suggests that PC, SD, and PC/SD ratio can be
considered as beneficial non-invasive markers for predicting the presence of
EVs in patients with hepatic cirrhosis. These parameters may help identify
individuals who should prioritize undergoing upper gastrointestinal endoscopy
for EV screening. However, comprehensive endoscopic examination should remain
the standard approach for the identification and treatment of EVs in cirrhotic
patients.
Author
contribution
Concept
development (provided idea for the research): SKHGh
and SF Design (planned the methods to generate the results): SM, SKHGh, FJ, ASh
Supervision (provided oversight, responsible for organization and
implementation): FJ, AH and NL Data collection/processing
(responsible for experiments, patient management, organization, or reporting
data) and data analysis/interpretation (responsible for statistical analysis,
evaluation, and presentation of the results):
NL, AH, SKHGh, SF
Literature search (performed the literature search and writing of the
manuscript): NL, AH and SKHGh
Drafting the manuscript (responsible for writing a substantive part of the
manuscript): All authors.
Conflict
of interest
The
authors declare that they have no competing interests.
Funding
There
is no funding agency involved in this research.
Ethics
approval and consent to participate
This
study was approved by the ethics committees of the Guilan
University of Medical Sciences [IR.GUMS.REC.1403.052]. Informed consent was
obtained from all individual participants
References
1. Al-Busafi SA, et al.
Clinical manifestations of portal hypertension. Int J Hepatol.
2012;2012:203794.
2. Garcia-Tsao G, et al. Portal hypertensive
bleeding in cirrhosis: Risk stratification, diagnosis, and management: 2016
practice guidance by the American Association for the study of liver diseases.
Hepatology. 2017;65(1):310-35.
3. Gralnek IM, et al. Challenges in the
Management of Esophagogastric Varices and Variceal Hemorrhage in Cirrhosis – A
Narrative Review. The American Journal of Medicine. 2024;137(3):210-7.
4. Verma A, et al. Sudden Death Caused by
Gastroesophageal Varices Rupture: Insights From an Autopsy-Based Case Series
Unraveling the Pathological Events. Cureus. 2023;15(9):e46166.
5. Sarangapani A, et al. Noninvasive
prediction of large esophageal varices in chronic liver disease patients. Saudi
J Gastroenterol. 2010;16(1):38-42.
6. Garcia-Tsao G, et al. Prevention and
management of gastroesophageal varices and variceal hemorrhage in cirrhosis.
Hepatology. 2007;46(3):922-38.
7. Pallio S, et al. Diagnosis and Management
of Esophagogastric Varices. Diagnostics (Basel). 2023;13(6).
8. Barrera F, et al. Platelet count/spleen
diameter ratio for non-invasive prediction of high risk esophageal varices in
cirrhotic patients. Ann Hepatol. 2009;8(4):325-30.
9. ElDesoky AE, et al. Platelet count/spleen
diameter ratio as a predictor of high-risk esophageal varices in patients with
liver cirrhosis. Medical Journal of Viral Hepatitis. 2022;6.2(2):25-30.
10. González-Ojeda A, et al. Platelet
count/spleen diameter ratio to predict esophageal varices in Mexican patients
with hepatic cirrhosis. World J Gastroenterol. 2014;20(8):2079-84.
11. Cherian JV, et al. Non-invasive predictors of
esophageal varices. Saudi J Gastroenterol. 2011;17(1):64-8.
12. Hong WD, et al. Predictors of esophageal
varices in patients with HBV-related cirrhosis: a retrospective study. BMC
Gastroenterol. 2009;9:11.
13. Madhotra R, et al. Prediction of esophageal
varices in patients with cirrhosis. J Clin Gastroenterol. 2002;34(1):81-5.
14. Gunda DW, et al. The magnitude and correlates
of esophageal Varices among newly diagnosed cirrhotic patients undergoing
screening fibre optic endoscope before incident bleeding in North-Western
Tanzania; a cross-sectional study. BMC Gastroenterology. 2019;19(1):203.
15. Levy C, et al. Prevalence and predictors of
esophageal varices in patients with primary biliary cirrhosis. Clin
Gastroenterol Hepatol. 2007;5(7):803-8.
16. Baig WW, et al. Platelet count to spleen
diameter ratio for the diagnosis of esophageal varices: Is it feasible? Can J
Gastroenterol. 2008;22(10):825-8.
17. Giannini EG, et al. Platelet count/spleen
diameter ratio for the noninvasive diagnosis of esophageal varices: results of
a multicenter, prospective, validation study. Am J Gastroenterol.
2006;101(11):2511-9.
18. Patil S, et al. Platelet Count/Spleen
Diameter Ratio as a Non-Invasive Predictor of Esophageal Varices in Cirrhotic
Patients: A Single-Center Experience. Gastroenterology Insights [Internet].
2024; 15(1):[98-106 pp.].
19. Shrestha R, et al. Endoscopic Detection and
Management of Esophagogastric Varices. Cureus. 2021;13(8):e16825.
20. Duah A, et al. Non-invasive markers as
predictors of oesophageal varices in cirrhotic patient in a teaching hospital
in Ghana. Ghana Med J. 2019;53(2):142-9.
21. Li S, et al. Assessment of Non-invasive
Markers for the Prediction of Esophageal Variceal Hemorrhage. Front Med
(Lausanne). 2021;8:770836.
22. Glisic T, et al. Diagnostic Value of
Non-invasive Scoring Systems in the Prediction of Esophageal Varices in
Patients with Liver Cirrhosis-Single Center Experience. Medicina (Kaunas).
2022;58(2).